We just deployed some significant changes to StatHat’s web interface. Here are some changes concerning viewing and analyzing stats:
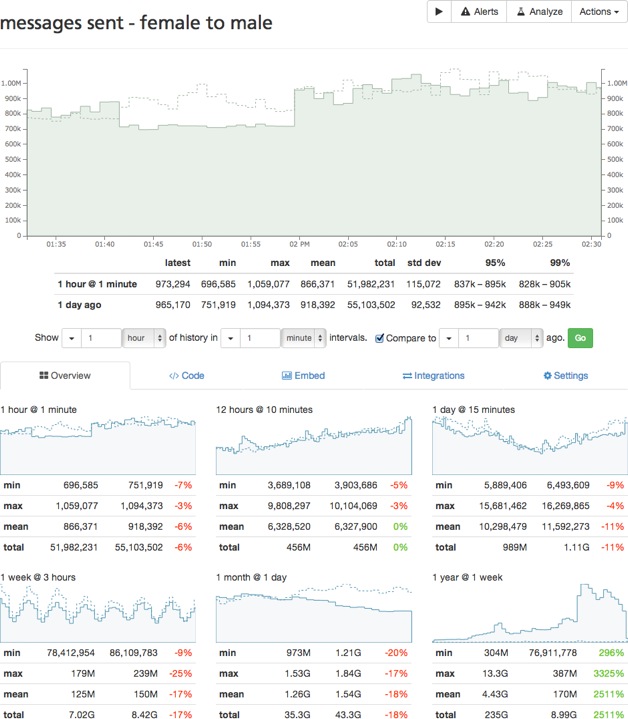
We changed the stat details interface to let you select any timeframe you want. Our standard one hour to one year overview still exists, but you don’t need to switch to the analyze interface to view something like 7 hours at 2 minute intervals.

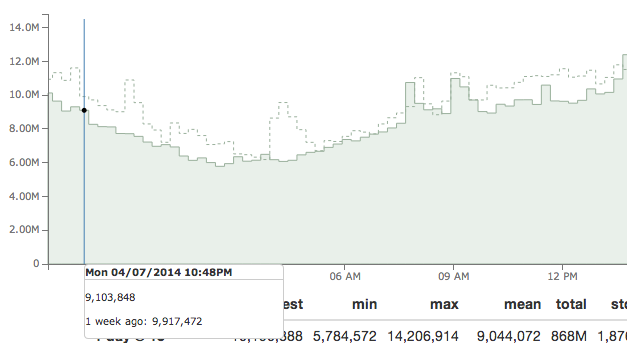
When you hover over the chart, you will now see the value at each data point.
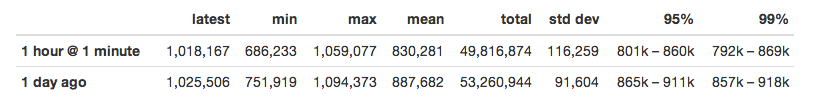
We are also including more summary data:
- most recent value
- standard deviation
- 95% and 99% confidence intervals
Pressing the Play button makes the chart automatically update every minute.

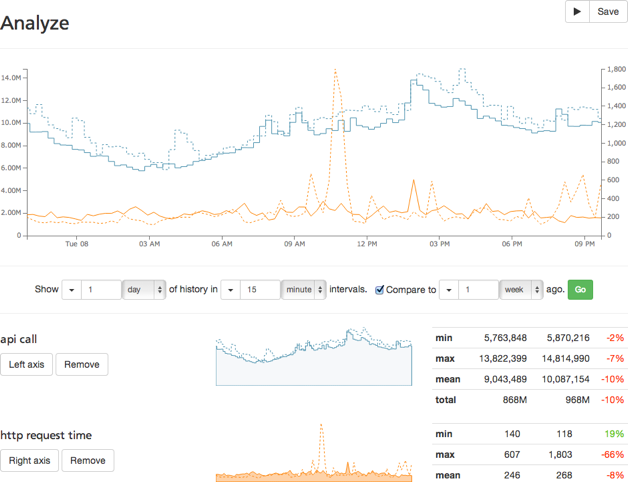
Like always, the analyze interface allows you to compare up to five stats on the same chart. Comparing stats of vastly different scales is easier now: the left and right axes are independent and can be set to any group of stats. Comparing the number of API calls (which ranges from 6M - 14M) with HTTP request times ranging from 100 - 1800ms is clearer.
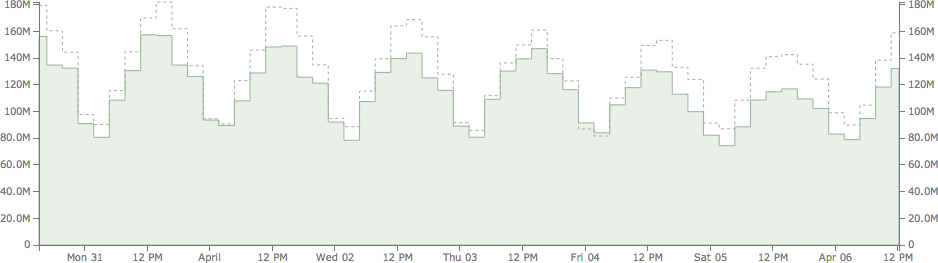
The charts are fully responsive, from large screens:
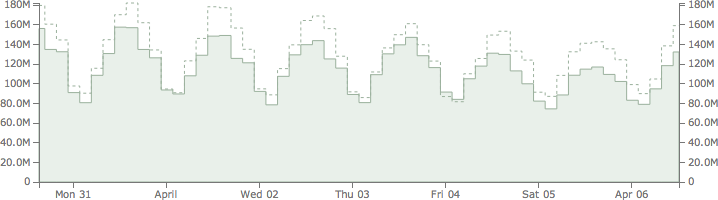
to medium:
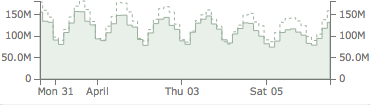
to small:
We made changes to make StatHat easier to use when you have lots of stats:
- stats are automatically collapsed into groups by common prefix
- intelligent filtering and improved search
- groups and saved searches visible in the stat list side bar
There are many more minor tweaks and updates, all with the goal of making StatHat a more useful tool to analyze your stats. Please let us know what you think of the changes.
Upcoming posts will highlight changes to alerts and describe the technologies behind these interface changes.