It is a bittersweet night here at StatHat as we have to say goodbye to one of
our oldest, most hard-working friends: api-ssl-balancer.
api-ssl-balancer was born on March 18, 2011 at 10:47:00 AM UTC-5. It has been
the endpoint for api.stathat.com since the beginning. Every single data point
on StatHat has gone through its gates: 9.76 trillion requests and counting.
In these days of cloud computing where servers are ephemeral and only up for a few
hours or days, we don’t have relationships with our servers. They are no longer
cleverly named after natural disasters or bivalve mollusks. But although it doesn’t
have a fancy name, api-ssl-balancer has been around and unchanged for almost 7 years.
Through thick and thin, api-ssl-balancer has always worked. Over the years, several
availability zones have gone dark, EBS stopped working for a day, EC2 instances
failed to launch, even good old S3 was unavailable. But api-ssl-balancer, you’ve always
been there, quietly sending HTTP requests along to our servers. You’ve been connected
to all the availabilty zones: us-east-1a, b, c, d, e, and f. Countless servers
in your autoscaling group have come and gone. When you were created, there was no
HTTP/2 or SPDY. We couldn’t even point a root DNS record at you. You’ve been around
so long that you are officially called “Classic”.
We know you understand. We need the new instance types. We need the enhanced network
performance. HTTP/2 will be nice for our users (and hopefully our bandwidth).
So last night, we changed the DNS record for api.stathat.com to point to a so-called
application load balancer that supports HTTP/2 in front of a VPC network.
But even after the TTL of 3600 seconds went by, api-ssl-balancer wouldn’t let go,
or maybe its friendly clients couldn’t believe that after 7 years the name was pointing
somewere else. 24 hours later and you still have 1,500 active connections and are
handling 700,000 requests per minute. With heavy hearts we’re going to have to turn
you off and force your clients to connect to your new sibling.
Goodbye, api-ssl-balancer…thank you for all the requests.
StatHat can now send alert notifications to Keybase team chat channels.
Since team chat on Keybase is end-to-end encrypted, we can’t just post
a message to some API endpoint like we do for Slack and PagerDuty.
You need to add our bot user to your team.
We created a Keybase user named stathatbot. You should check it out
to make sure it is legit by doing:
keybase id stathatbot
It should have valid proofs for @stathat on twitter, DNS for stathat.com,
and DNS for numerotron.com. Given those proofs, you can be confident that
stathatbot belongs to us here at StatHat. You can follow stathatbot
to keep track of its proofs and notice any changes.
Now you need to add stathatbot to one of your teams. Please note that
once on the team, stathatbot will be able to read (and write) messages
to all the channels on the team.
The best way to protect your data is
to use a subteam that is just for alerts or bots. If stathatbot is
just a member of a subteam, it can only access chat channels in that subteam,
and not the root team or any other subteams. So, let’s say your team on
Keybase is treehouse, you would do:
keybase team create treehouse.alerts
to create the subteam. And then
keybase team add-member treehouse.alerts --user=stathatbot --role=reader
The reader role is a little confusing, but it means that it will only
have read access to any files you happen to put in /keybase/team/treeehouse.alerts.
It can still read and write to any chat channel in treehouse.alerts.
(For the record, the stathatbot doesn’t even have file system access turned
on, but you should still give this bot as little access as you can.) You will
need to add yourself and anyone else that wants to see the alerts to the subteam.
Now, you’re all set on the Keybase side.
In StatHat alert destinations settings, there’s a new
section for Keybase. You would enter treehouse.alerts for the team name
and you can leave the channel blank to use the default general channel.
Once you enable this Keybase destination for manual and automatic alerts on the main settings page,
all alert notifications will be sent to your Keybase team’s chat channel.
Let us know if you have any further questions or issues setting this up.
P.S. If you’re curious how this works: we have an isolated server where there’s a
user logged in to Keybase as stathatbot. There’s some code pulling alerts off
of an SQS queue. When it gets one it uses keybase chat api to send a message
to the appropriate team/channel.
A typical response to a StatHat stat API call looks like this:
HTTP/1.1 200 OK
Content-Type: application/json
Date: Tue, 02 May 2017 14:53:45 GMT
Content-Length: 25
Connection: keep-alive

{"status":200,"msg":"ok"}
It’s pretty small. 152 bytes. But users sent in 150 billion requests
last month, and StatHat responded with that 152 bytes to them all, which
is 20 terabytes.
After studying RFC 7231, we are going
to change the default success response to:
HTTP/1.1 204 No Content
It is 25 bytes (maybe 26 with a blank line after the header), 127 bytes leaner.
The 204 response is an accurate description of a successful API request:
The 204 (No Content) status code indicates that the server has
successfully fulfilled the request and that there is no additional
content to send in the response payload body.
While the Date header field is encouraged, it is optional:
An origin server MUST NOT send a Date header field if it does not
have a clock capable of providing a reasonable approximation of the
current instance in Coordinated Universal Time.
So let’s just pretend we don’t have a good clock.
None of the official StatHat libraries look at the body of the response,
they just care about the 2xx success status. We have tried this response
in production on a subset of the requests and have not received any reports
of it being a problem, so we are rolling it out for all requests.
Note that we will still provide details for multiple stats uploaded in
a JSON request and any error cases.
If you have code that parses the original body and would like to continue
doing so, include a vb=1 request parameter with your POST or GET request
and the servers will respond with the original verbose body output.
This change should remove about 17 terabytes of useless data from the
internet pipes each month.
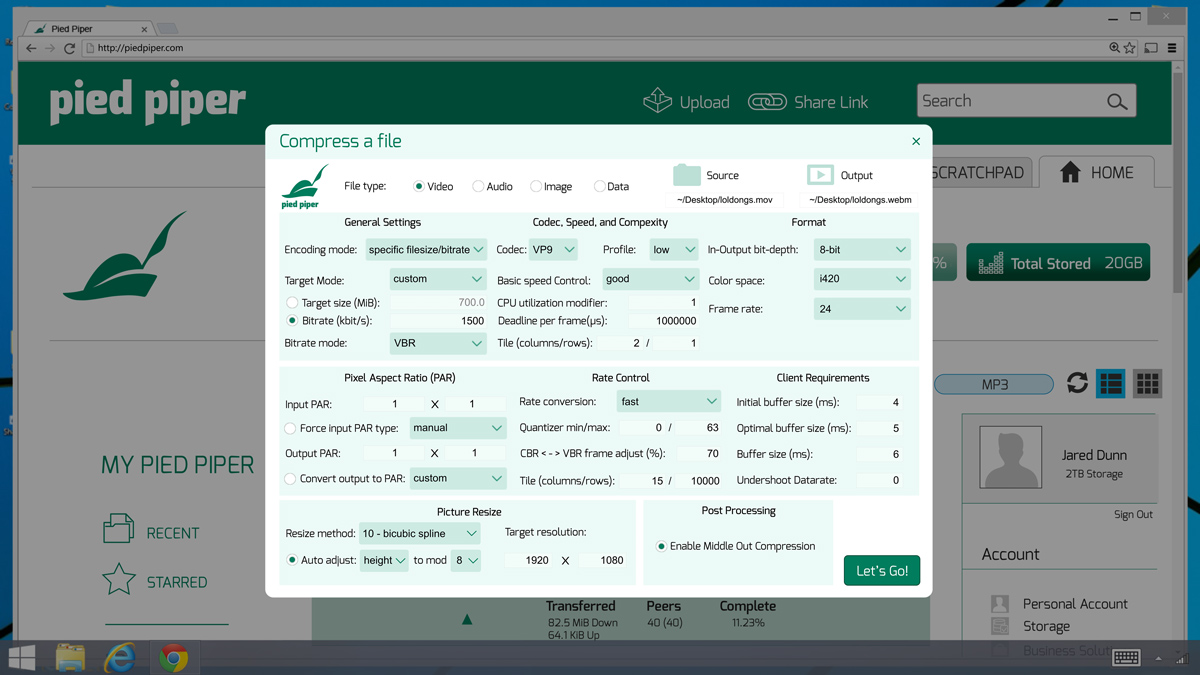
No, of course a fictional company on a TV show isn't using a real service
like StatHat.1 But it sure looks like they are.

Season 3, Episode 9 Daily Active Users was all about two stats: Installs
and Daily Active Users. Tracking these with StatHat would be a piece of cake.
Let's just assume "Installs" means "New User Created". In the show, they compare
Installs to Daily Active Users. "Installs" doesn't make much sense for
what appears to be primarily a web service.2
So whenever a new user is created, they
could add one line of code to track this as a counter stat:
db.Exec("INSERT INTO users (id, email, created_at, active_at) VALUES (?, ?, NOW(), NOW())", id, email)
stathat.PostEZCount("installs", "stats@piedpiper.com", 1)
Whenever a user did something on the Pied Piper platform, they could update the
user row in the database:
db.Exec("UPDATE users SET active_at=NOW() WHERE id=?", id)
Then they could have a script that ran via cron every minute to send the
number of active users in the past 24 hours to StatHat:
var dau int
db.QueryRow("SELECT COUNT(*) FROM users WHERE active_at > NOW() - INTERVAL 24 HOUR").Scan(&dau)
stathat.PostEZValue("daily active users", "stats@piedpiper.com", dau)
Those two calls to StatHat are all it takes to track these stats. They don't
need to be created on the website first as StatHat will create new stats dynamically
when it receives a new stat name.
The installs stat is a counter. Every time someone signs up for Pied Piper, it sends
a count of 1 to StatHat. StatHat will then sum these up over time.
The daily active users stat is a value. Every minute, the cron script sends
the current daily active users value to StatHat. StatHat will then average this value
over time.
Now that the data is going to StatHat, there are many options for viewing it.
The web interface allows you to inspect the data at any timeframe, compare multiple
stats. It also has cards that would
be an easy way to create a dashboard of Installs and Daily Active Users. Or
Panic's Status Board would
be another easy choice.
But there's also an embed API that allows you to embed stat data on any web page,
which would be one way to get a similar looking dashboard to the one on the show.
The stat integrations page gives you a small block of JavaScript you can paste
in any web page. Here's a stat embedded on this blog post, styled to look somewhat
similar to the Pied Piper dashboard:
The code to do this looks like:
<script src="//www.stathat.com/js/embed.js"></script>
<script>StatHatEmbed.render({kind: 'text', s1: 'K6xI3hBsBACxjF9nAd7IhOPw8RbKH5XJ'});</script>
That's all that is needed. You should see the number displayed above change every minute.
Since this stat is a counter, StatHat is displaying the total count received over the timeframe.

Perfect for milestone parties:
 Footnotes
1: Betteridge's law of headlines is true in this case.
2: Yes, the "platform" is available on all devices so could be installable software, but it is also clearly a web service:
We created a chart service that lives at chartd.co. It
allows you to create responsive, retina-compatible
charts with just an img tag. Like this:

That whole chart came from this URL:
https://chartd.co/a.svg?w=580&h=180&d0=RXZZfhgdURRUYZgfccZXUM&d1=roksqfdcjfKGGMQOSXchUO&d2=y3vuuvljghrgcYZZcdVckg&d3=kdfffcZYbggdfdhkkkgjgk&ymin=45&ymax=90&t=Temperature
We built it a long time ago and StatHat has been using it to include charts
in alert and report emails. While we told a few other
companies about it, we never officially announced it.
All the documentation for it is on the main page at
chartd.co.
Please let us know what you think of it!
